Bitcoin Price History Statistics: Every Major Bull Run and Bear Market Explained
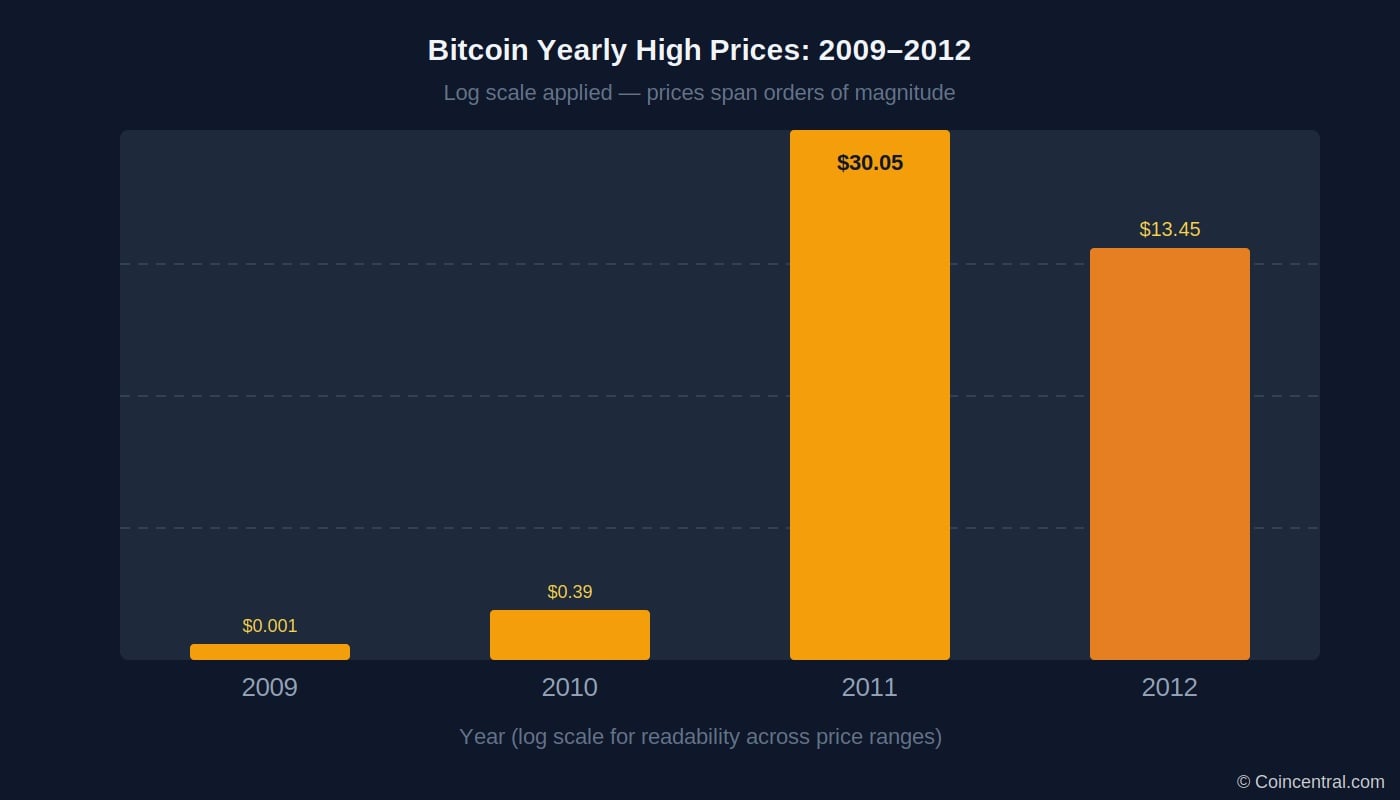
Image: CoinCentral
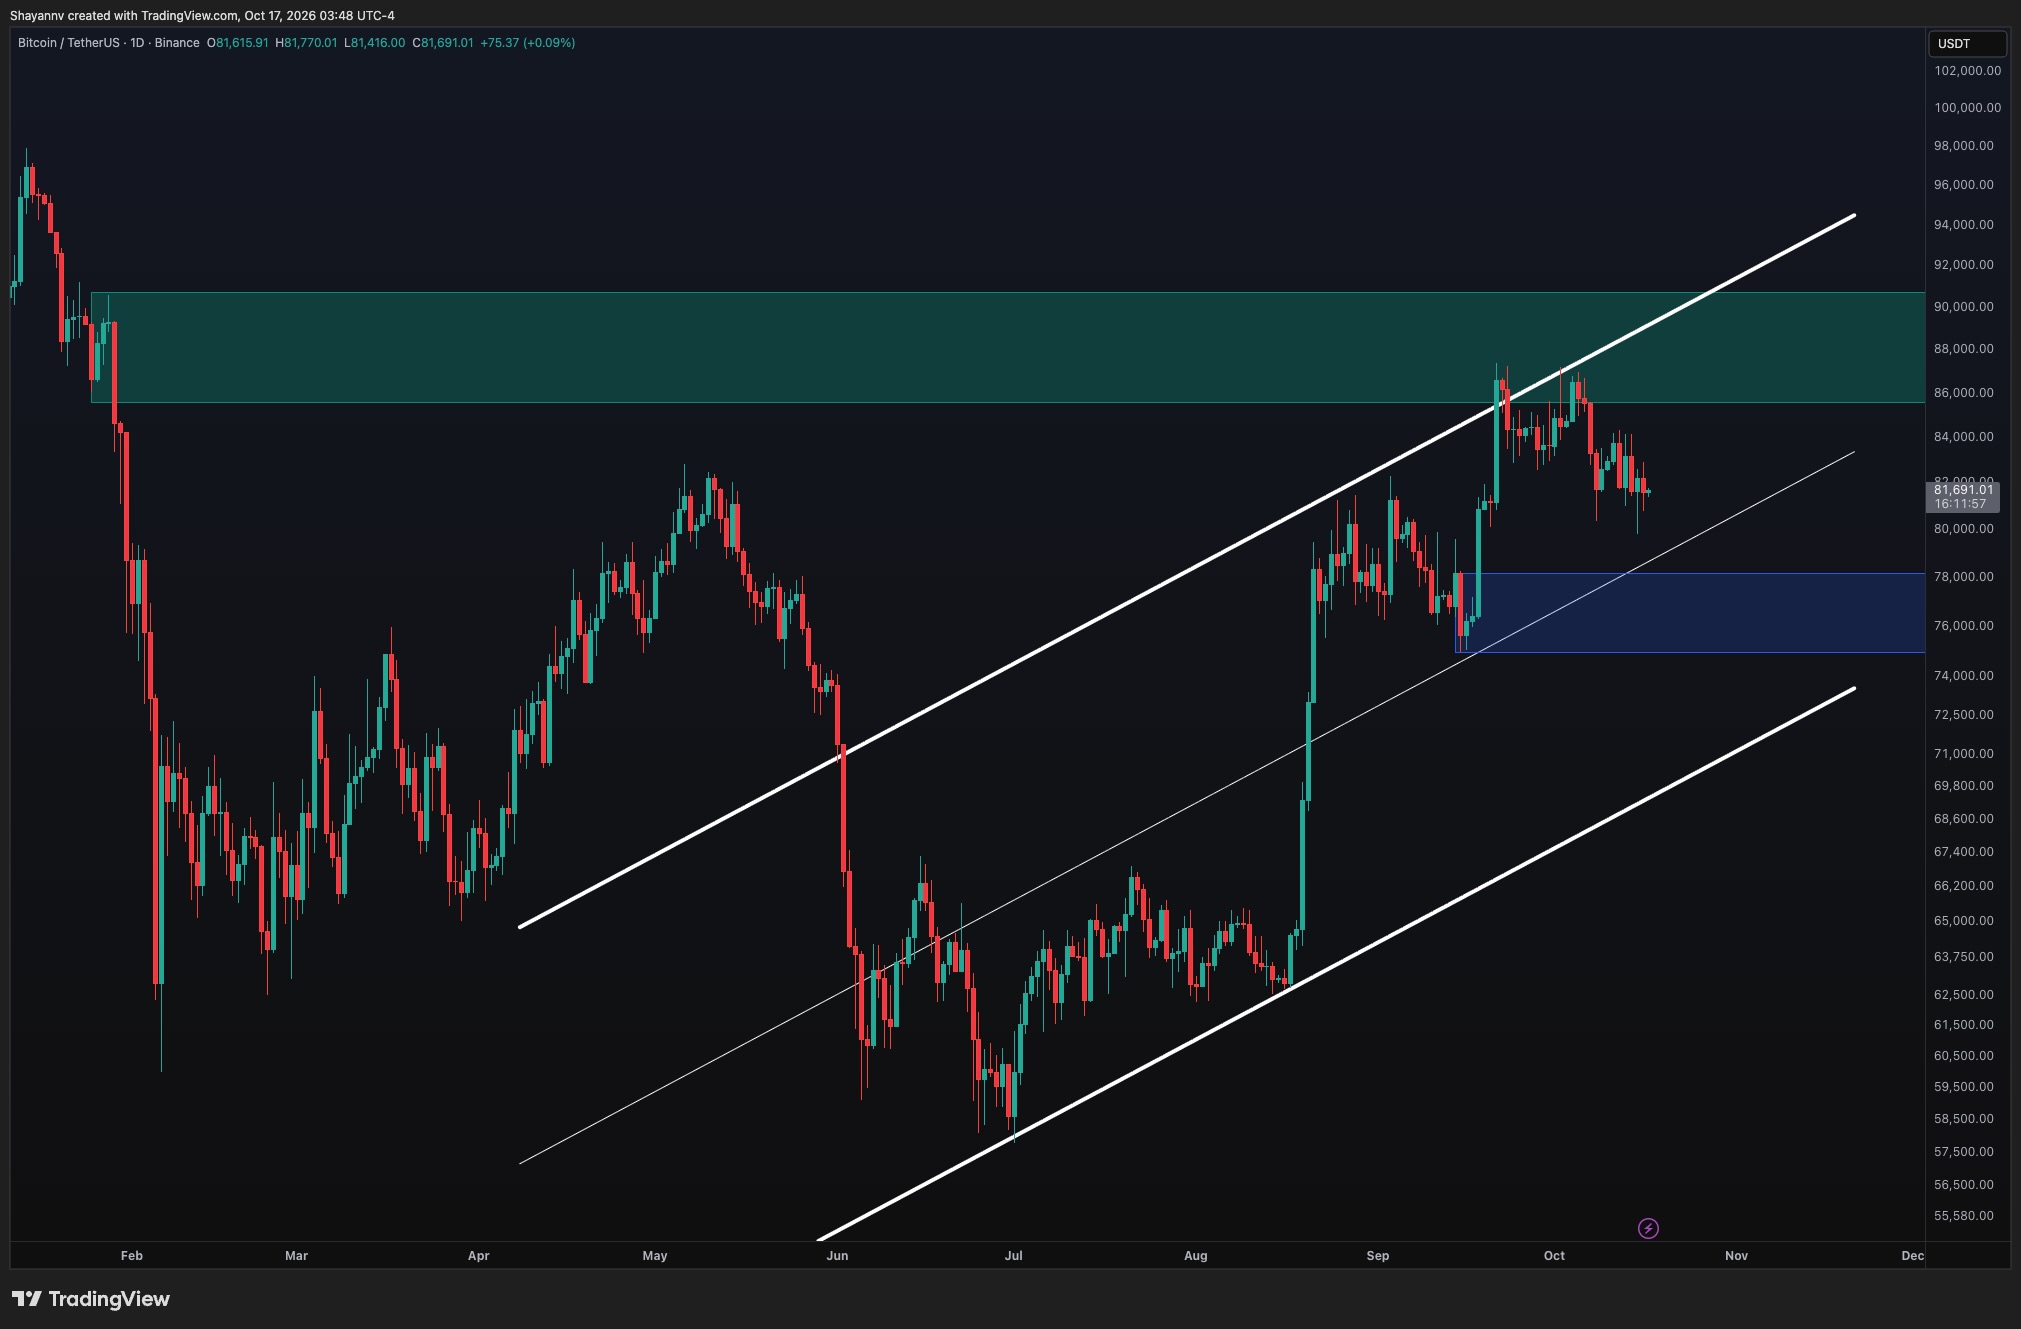
Bitcoin launched in January 2009 with no monetary value. Today it trades above $80,000. That journey covers 16 years, four halving events, multiple crashes of over 80%, and a shift from a niche tech experiment to an asset held by major institutions and retirement funds. This article pulls together the key statistics from Bitcoin’s full price history. Each section covers a major era, with tables showing the data and charts you can download. Bitcoin remains one of the most volatile assets in the world. Nothing in this article is investment advice. The goal is a clear, factual record of what the data shows. The Genesis Years: 2009–2012 Bitcoin’s first recorded price was $0.00099 per coin.
Read the full story on CoinCentralBeCrypto News shows a short excerpt and links to the publisher. The full report belongs to CoinCentral.