Bitcoin Price Analysis: Where Is the Bottom as BTC’s Correction Accelerates?
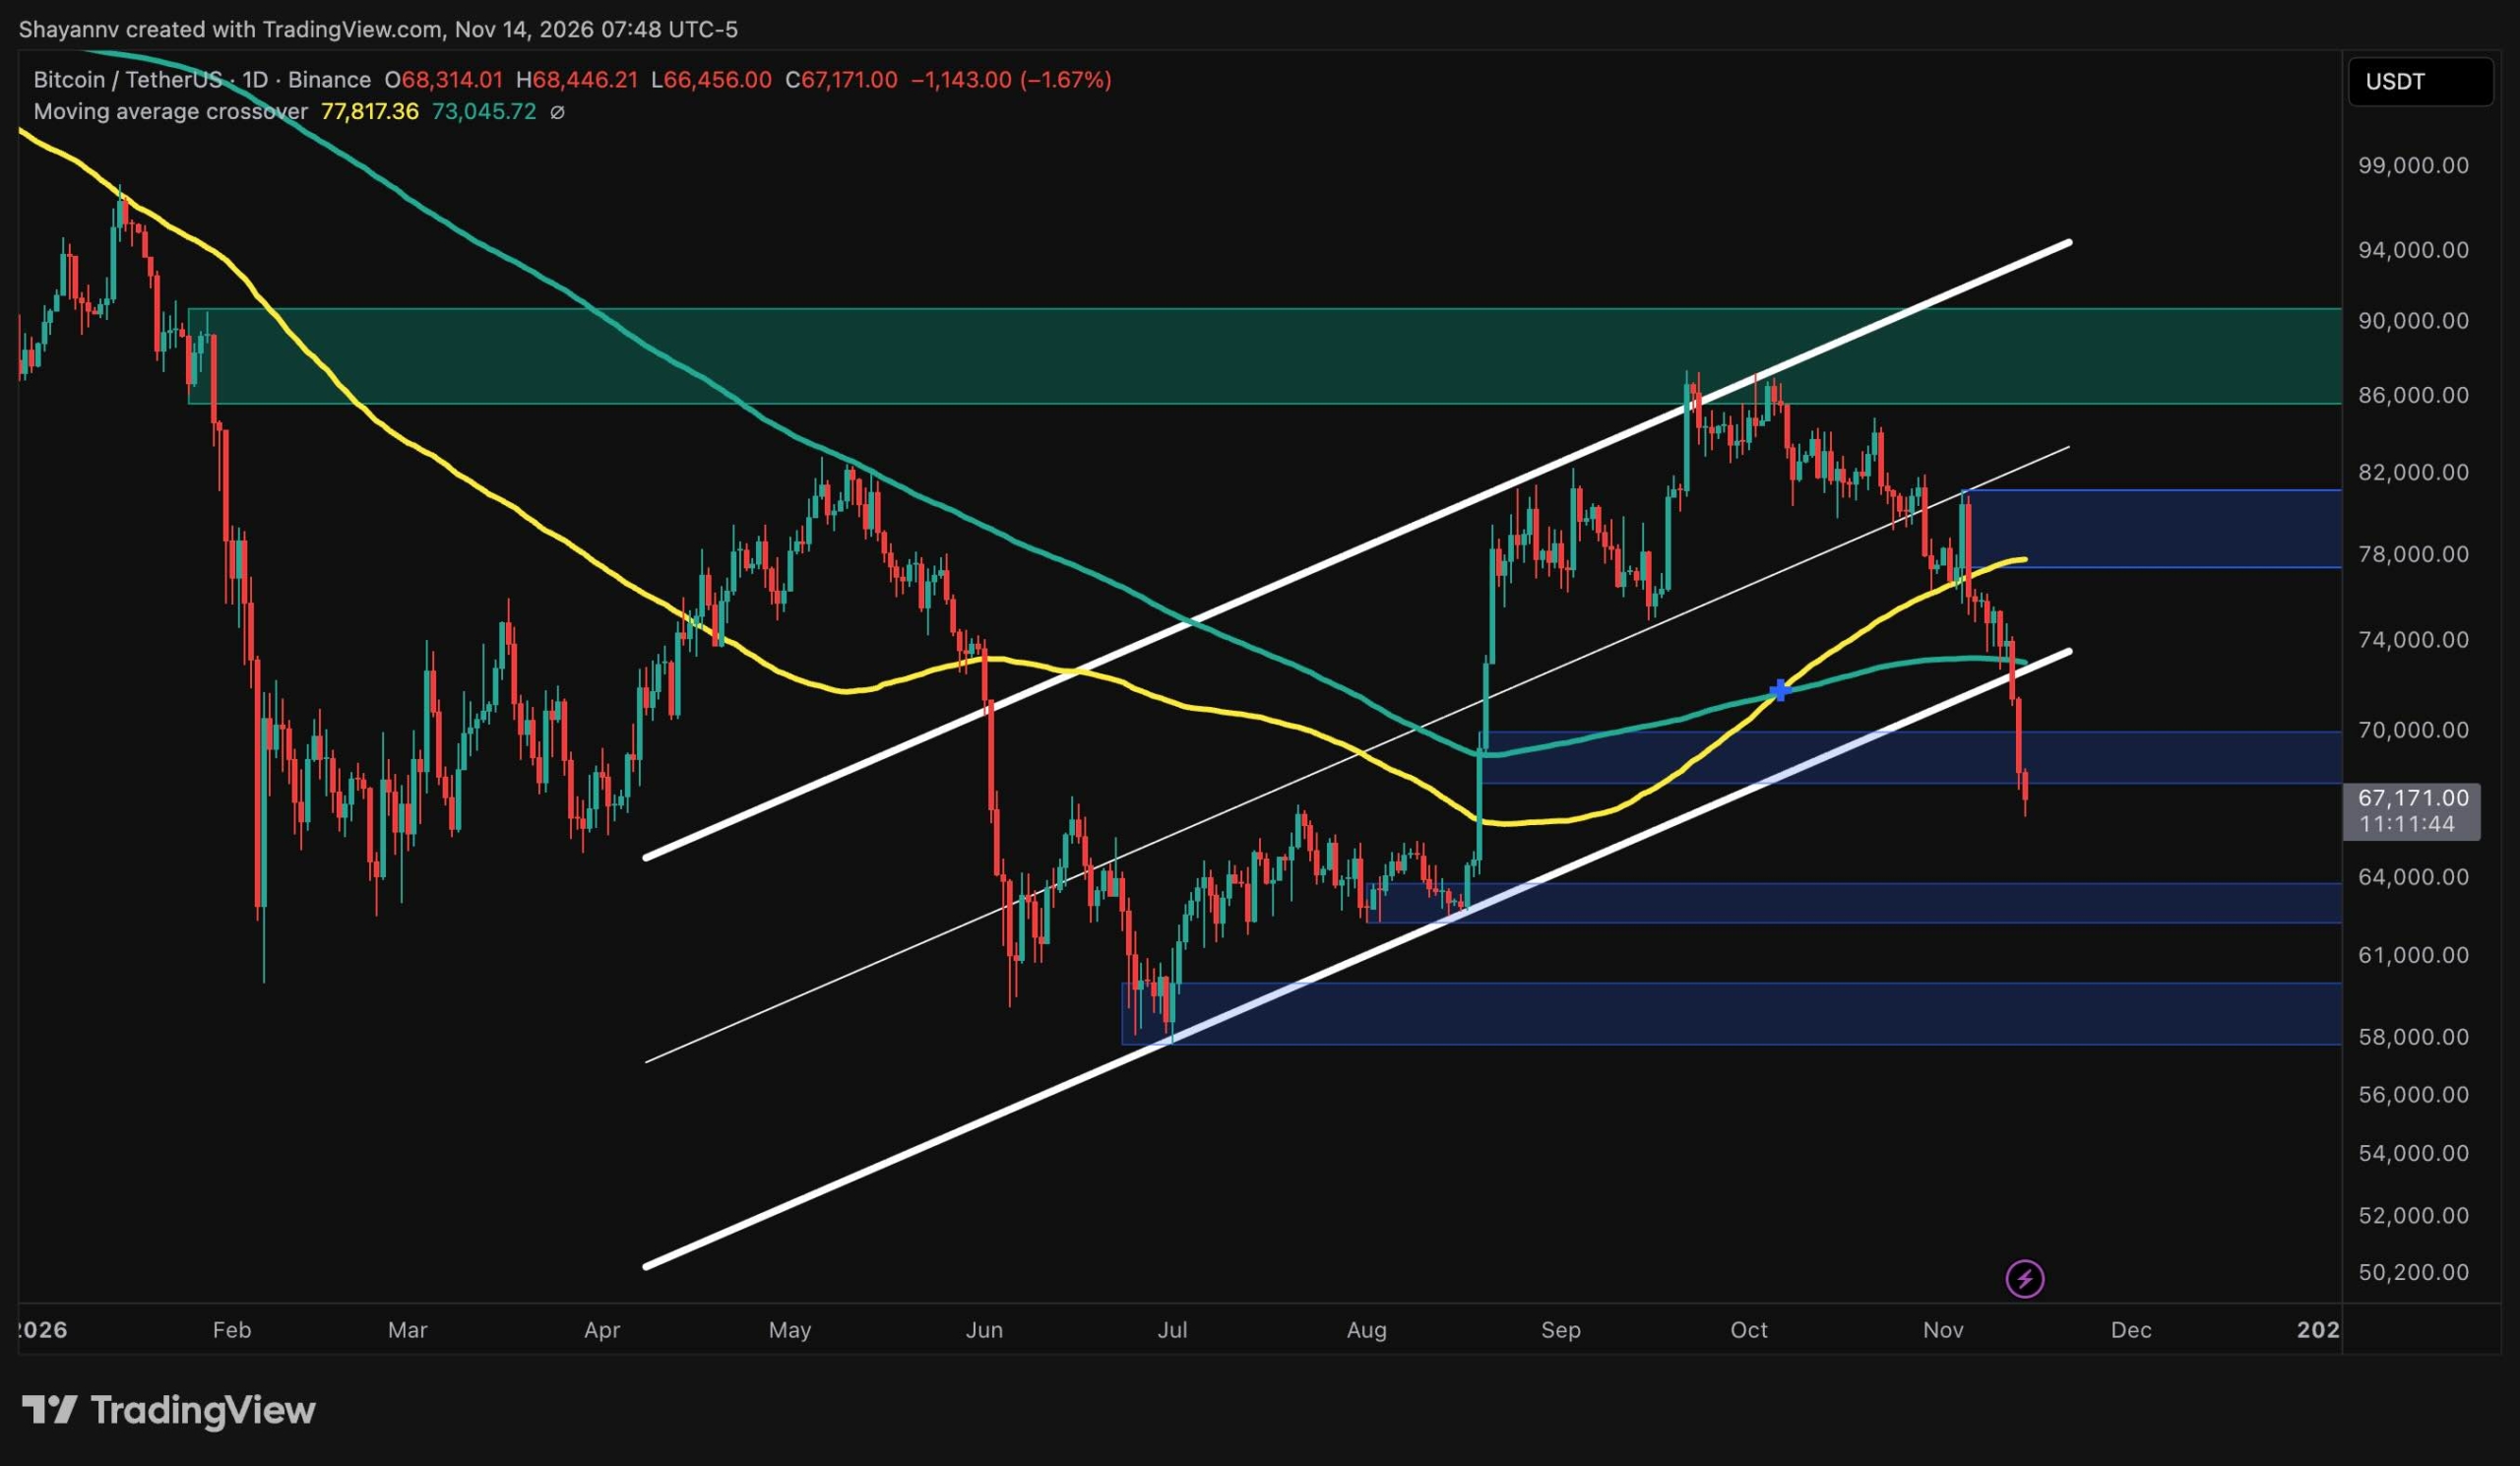
Image: CryptoPotato
Bitcoin’s correction has sped up over the past week and is now dropping almost vertically. It currently trades around $65K after cutting through several support levels. The latest drop pushed BTC below its daily ascending channel and the key $70K support zone, which leaves deeper demand areas exposed. Meanwhile, the Adjusted SOPR metric indicates that coins moving on-chain are now, on average, being spent at a loss again, which is not a good signal. Bitcoin Price Analysis: The Daily Chart On the daily chart, Bitcoin has broken below the lower boundary of the ascending channel that guided its recovery from the June lows. The breakdown followed a rejection from the $80K zone in early November.
Read the full story on CryptoPotatoBeCrypto News shows a short excerpt and links to the publisher. The full report belongs to CryptoPotato.