Bitcoin Price Analysis: Can BTC Hold $70K After a Brutal $10K Weekly Drop?
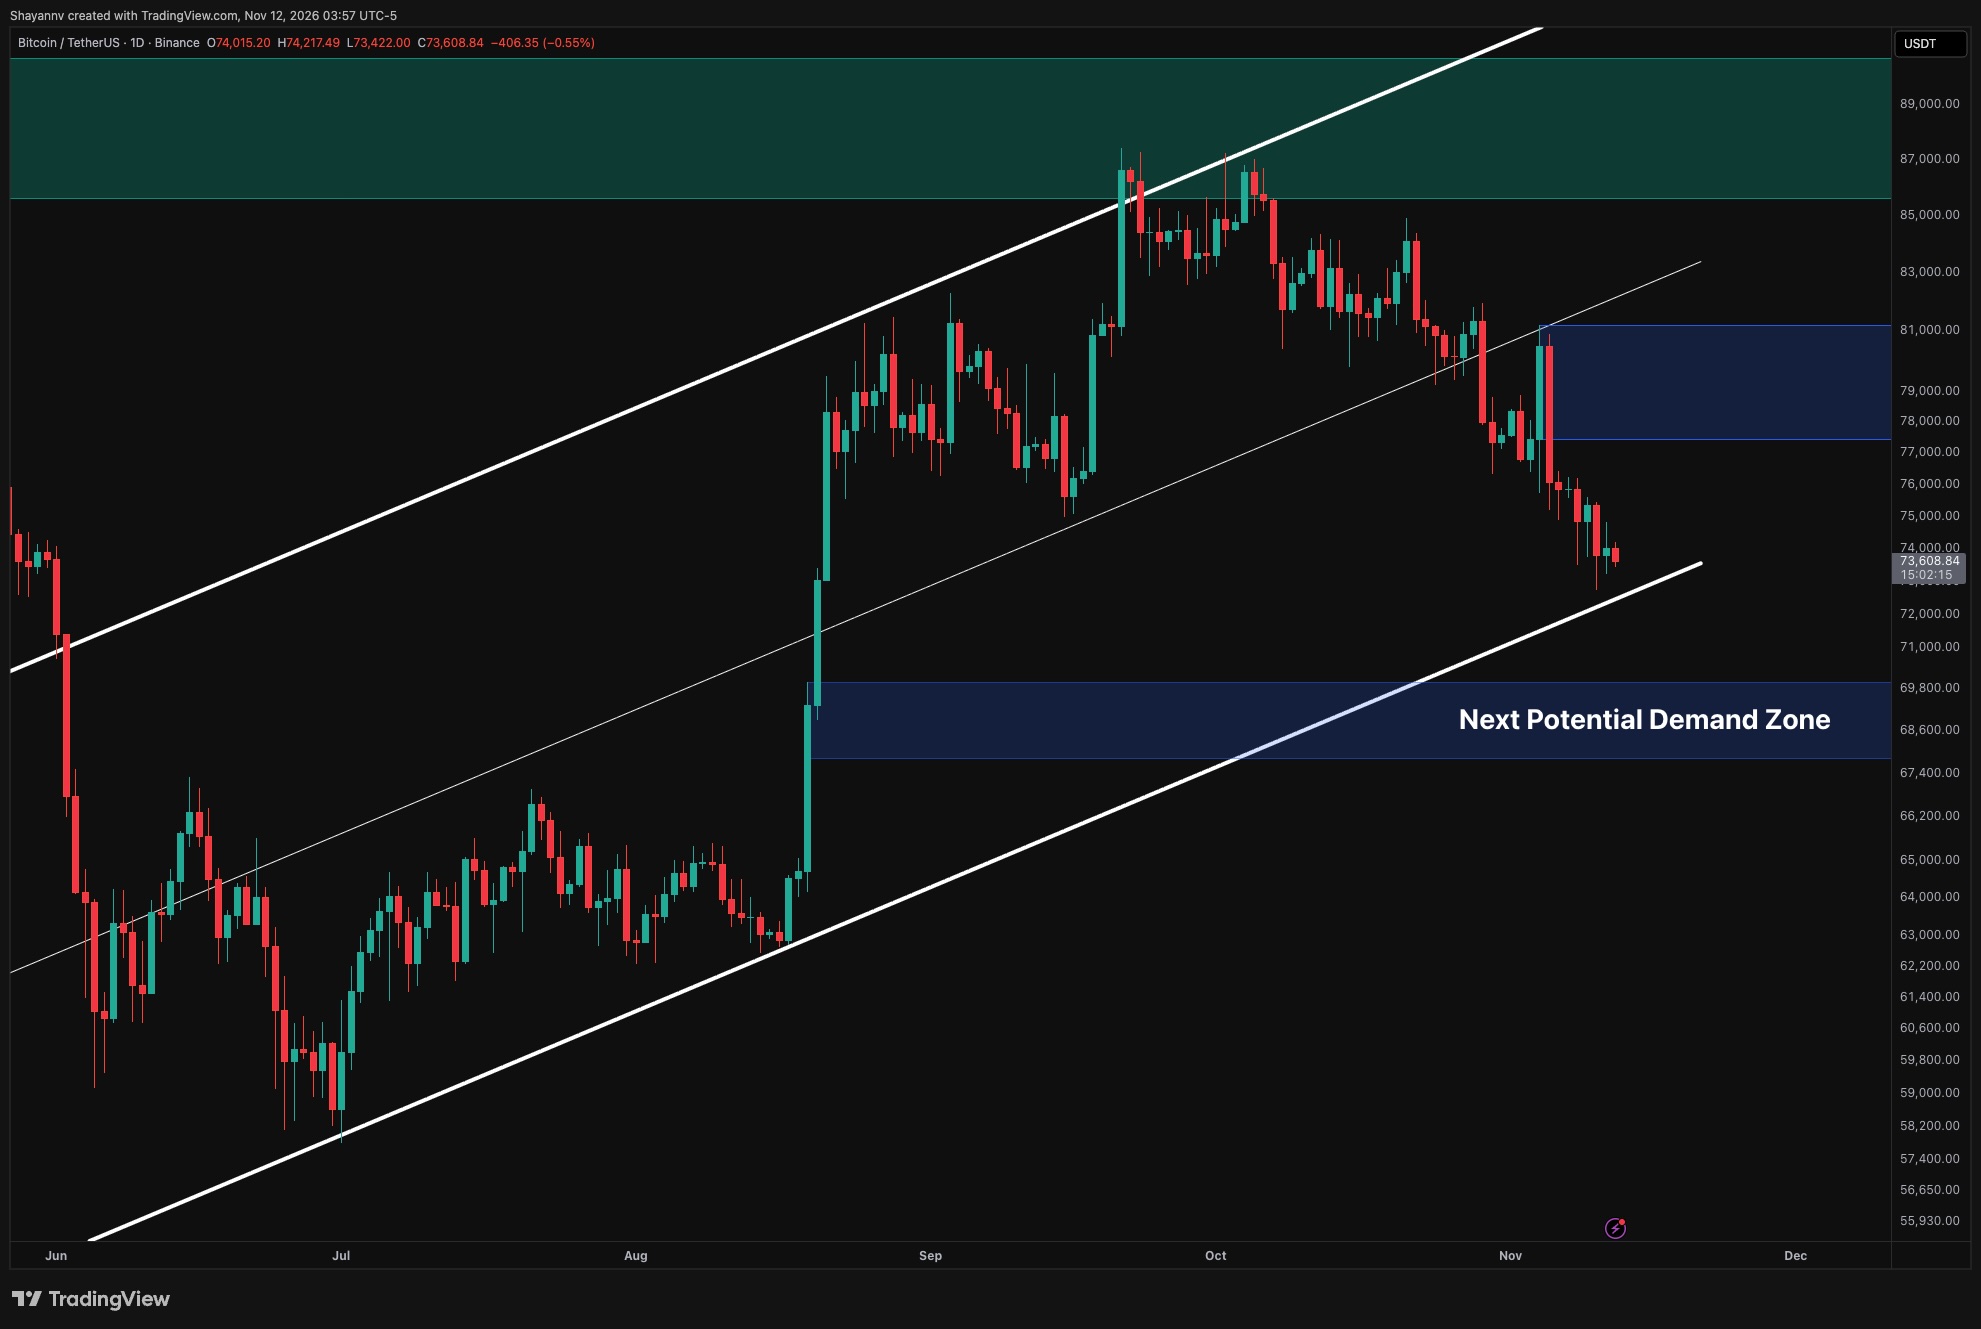
Image: CryptoPotato
Bitcoin is approaching the lower boundary of its broader ascending channel after extending its decline toward $71K. Buyers have responded near short-term demand, but failed recoveries and heating futures activity leave the market vulnerable to further volatility. Bitcoin Price Analysis: The Daily Chart The daily chart shows Bitcoin continuing to form lower highs and lower lows after losing the ascending channel’s midpoint. The failed recovery toward $81K was followed by sustained selling, with the price now approaching the channel’s lower boundary around $70K-$71K. This trendline is an important test of the broader rising structure. Although the recent decline produced a lower wick near $71K, the subsequent rebound has been modest. Buyers have yet to establish a convincing reversal, leaving the channel support exposed to another test.
Read the full story on CryptoPotatoBeCrypto News shows a short excerpt and links to the publisher. The full report belongs to CryptoPotato.