Ripple Price Analysis: Is the Worst Over for XRP After Holding $1.30?
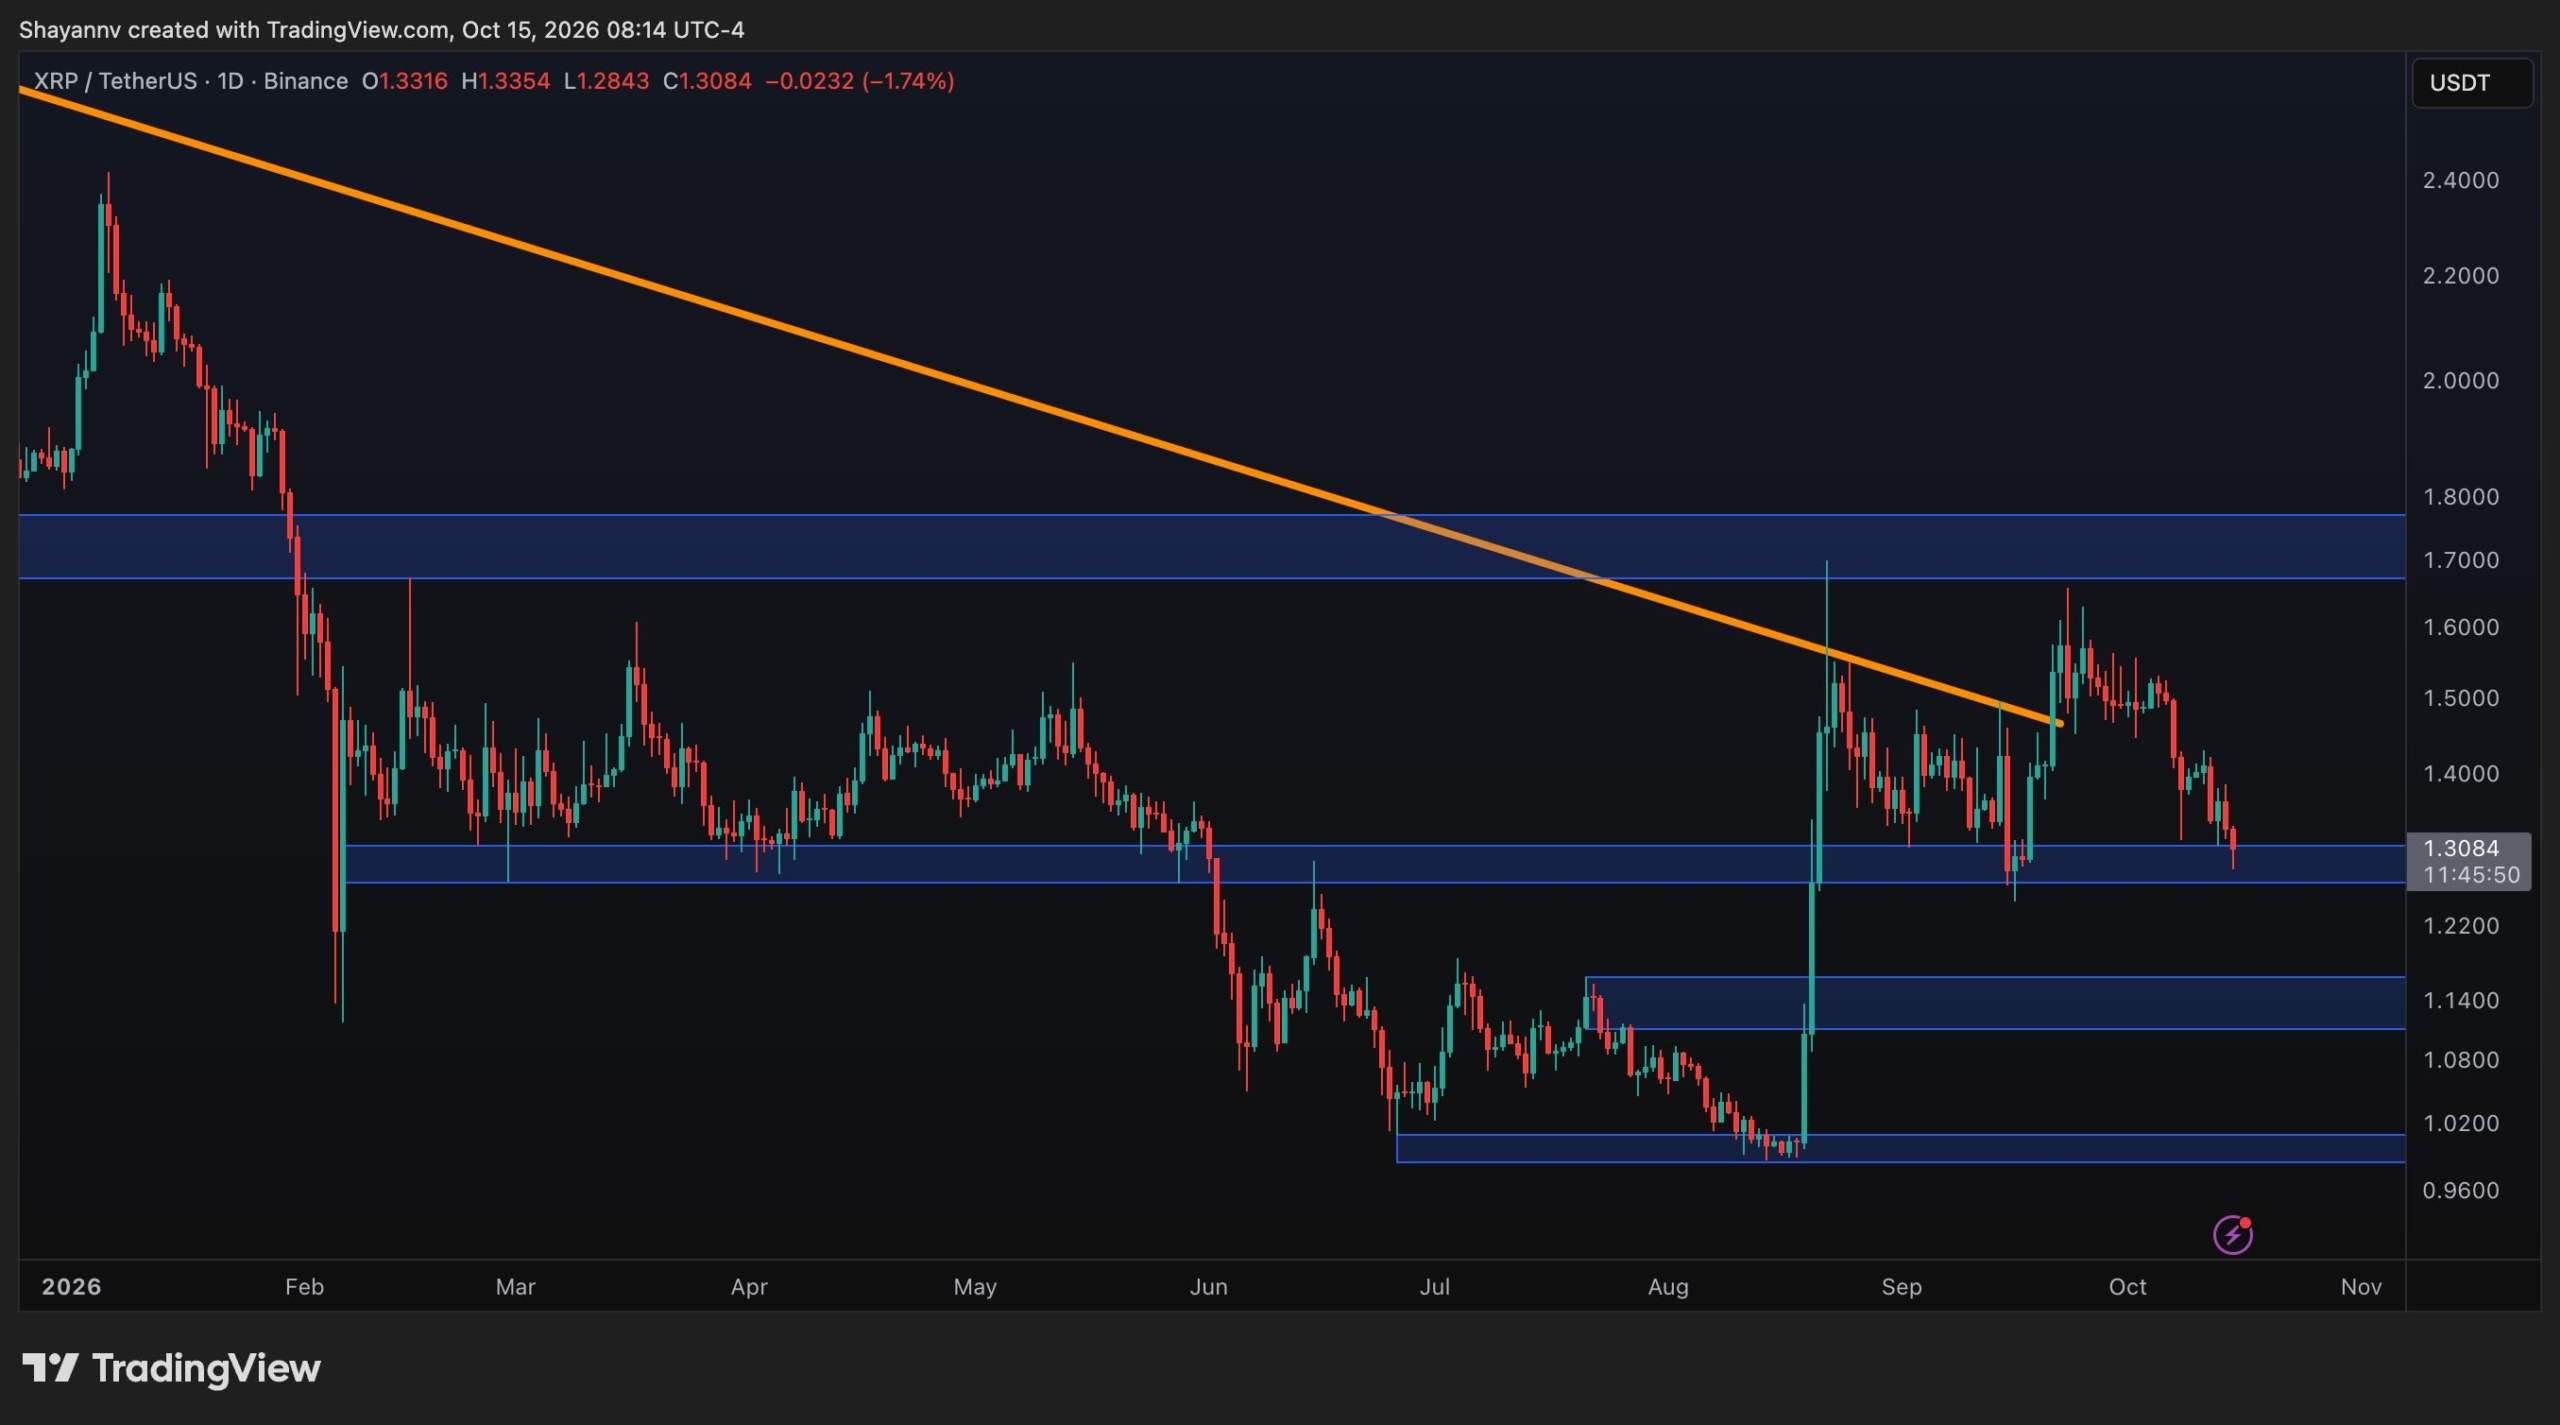
Image: CryptoPotato
XRP is approaching a key technical inflection point after weeks of declining price action erased much of its August recovery. Trading around $1.30, the asset is testing an important support zone on both the daily and 4-hour charts. The next move around this area could determine whether buyers manage another rebound or sellers push XRP toward lower support levels. Ripple Price Analysis: The USDT Pair The daily chart shows XRP maintaining a broader bearish structure after falling from its early-2026 highs above $2.30. The asset has formed a series of lower highs, while the descending orange trendline continues to reflect the prevailing downward pressure, as the price has once again dropped below it and failed to continue higher.
Read the full story on CryptoPotatoBeCrypto News shows a short excerpt and links to the publisher. The full report belongs to CryptoPotato.